If you sell
What could you walk away with?
Likely selling price, less agency fees, transaction costs, mortgage repayment and any tax due.
Release capital and move on.


 +44 685 88666

London homes. Your options.
Selling could release your capital. Letting could generate income. But what would each option really leave you with after costs, fees and tax?
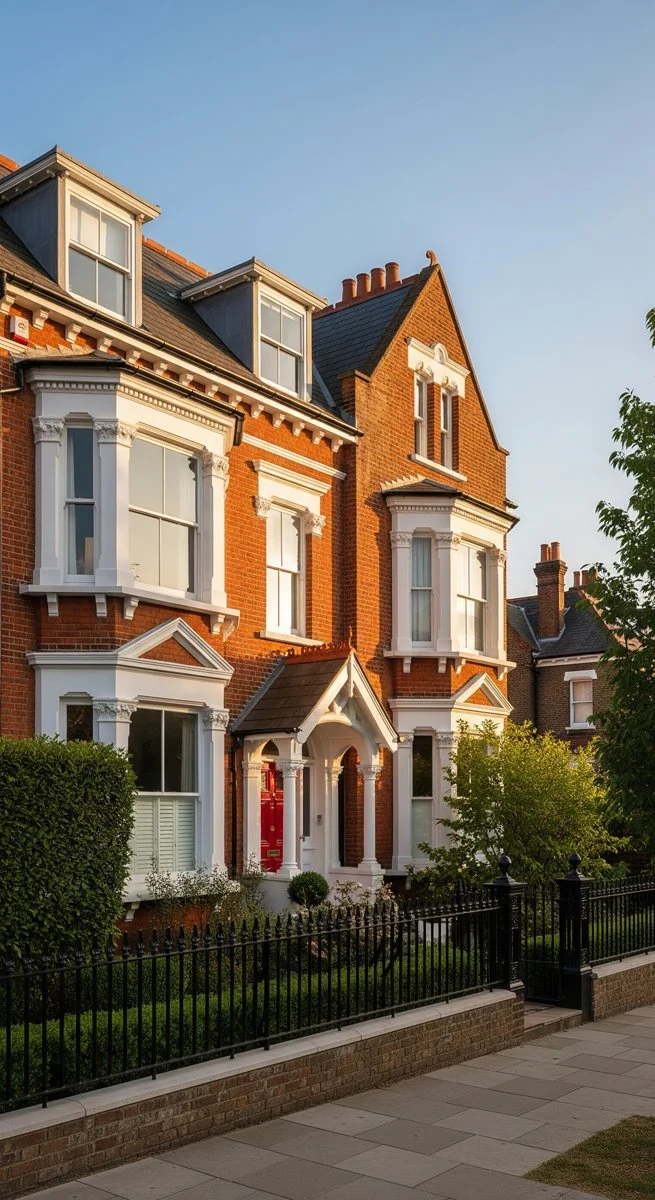 Sell. Let. Or wait.
Start with the real numbers
Then weigh your future plans, financial needs and appetite for being a landlord.
Tax and financing depend on your circumstances. Specialist advice may be needed.
Whichever way you go
Fixed fees. Not a percentage of your sale price or rent.
Paid in stages: £600 on instruction, £1,895 on offer acceptance and £2,500 on completion.
+ £249per month equivalent
Management: £2,988 a year, billed in advance.
No VAT added. Fees per property. Third-party costs and optional protection are separate.
Full fees and service terms (opens in a new tab)Advice before action
Your free Property Options Review helps you compare both routes using local market evidence and commercial insight.
Our approach is informed by our founder's experience as a chartered accountant and former Big Four partner.
Sell, let or wait. No obligation to instruct us.
Start with your property and the best way to reach you.
Name, address, email and WhatsApp number. Then pick a time.